Preview
Hüseyin Akbulut, MSc (2026). HRV Training: How Heart Rate Variability Guides Workouts. Sporeus. Retrieved, October 6, 2026. https://sporeus.com/en/sport/hrv-training-guide/
HRV Training: How Heart Rate Variability Guides Workouts
Author: Hüseyin Akbulut — BSc Sport Sciences (rowing), MSc Marmara University
Table of Contents
- HRV Training: How Heart Rate Variability Guides Workouts
- The Physiology of HRV: What You Are Actually Measuring
- Kiviniemi's Research: The Evidence Foundation
- rMSSD: The Right Metric for Athletic Monitoring
- Measurement Protocol: Consistency Is Everything
- Building Your Personal Baseline
- Practical Decision Rules
- Which Apps Are Evidence-Based?
- Conclusion
- References
Heart rate variability has moved from sports science laboratories to the bedrooms of millions of recreational athletes in less than a decade. The technology is democratised; the science behind it took decades to develop. The practical questions for athletes are not theoretical — they are immediate: Should I do the hard session today or back off? Is my training load appropriate, or am I accumulating more fatigue than I am recovering from? Is my body ready to absorb the stimulus I am about to give it?
HRV offers a daily window into the autonomic nervous system’s state that is more sensitive than resting heart rate, more objective than subjective fatigue ratings, and more practically accessible than blood biomarkers. But interpreting HRV data correctly requires understanding what it actually measures, which metrics are scientifically meaningful, and what the controlled intervention research actually shows about HRV-guided training’s benefits over fixed programmes.
The Physiology of HRV: What You Are Actually Measuring
The interval between consecutive heartbeats — the R-R interval, named for the R-peak in an electrocardiogram waveform — varies continuously in milliseconds. This beat-to-beat variation is regulated by the interplay of sympathetic and parasympathetic branches of the autonomic nervous system. The sympathetic branch (fight-or-flight) shortens R-R intervals and reduces variability. The parasympathetic branch (rest-and-digest), acting primarily via the vagus nerve, lengthens R-R intervals and increases variability.
A well-recovered athlete in a parasympathetically dominant state therefore shows higher HRV. An athlete carrying cumulative training fatigue, sleep debt, illness, or psychological stress shows sympathetically dominant tone — lower HRV. This inverse relationship between physiological stress load and HRV provides the foundation for using HRV as a training readiness indicator.
The critical qualification is that HRV reflects total allostatic load, not specifically training fatigue. A day of poor sleep, an argument, a difficult week at work, illness, or inadequate caloric intake all depress HRV through the same autonomic mechanisms as excessive training. This means HRV is a useful general stress monitor rather than a training-specific readiness test — a distinction that matters for interpretation but does not reduce its practical utility.
Kiviniemi’s Research: The Evidence Foundation
Tae Kiviniemi and colleagues at the University of Oulu in Finland produced the most directly relevant controlled research on HRV-guided training in endurance athletes. Their 2007 and 2010 studies compared a group whose training intensity was prescribed based on daily morning HRV readings against a group following a pre-set periodised programme with equal total training volume.
The HRV-guided group followed a simple decision rule: on days when morning HRV was above a threshold (indicating good recovery and parasympathetic dominance), they performed a planned hard session. On days when HRV was below threshold (indicating accumulated fatigue or stress), they replaced the planned hard session with a low-intensity session or rest. Total training time was matched between groups; only the distribution of hard versus easy sessions varied.
The HRV-guided group showed significantly greater improvements in VO₂max over the study period compared to the fixed-programme group. They also reported lower subjective fatigue at matched training loads. Kiviniemi’s interpretation was that HRV-guided training allowed harder sessions to be performed when the body was best prepared to respond to the stimulus, and prevented unnecessary hard sessions that added fatigue without productive adaptation. The result was higher quality high-intensity work without increased total training time.
Subsequent research by Vesterinen and colleagues (2016) replicated and extended these findings. In a 28-week study of recreational endurance runners, an HRV-guided group improved 3km time trial performance significantly more than a heart rate zone-based training group. The HRV group also showed greater improvements in VO₂max and running economy. Importantly, the HRV group performed more high-intensity training on days with good HRV readings and dramatically less on poor HRV days — a natural polarisation that emerged from the decision rule without being explicitly prescribed.
rMSSD: The Right Metric for Athletic Monitoring
HRV can be quantified by many mathematical parameters, broadly grouped into time-domain, frequency-domain, and nonlinear methods. For the specific application of daily athletic monitoring, research strongly favours rMSSD — the root mean square of successive differences between adjacent R-R intervals — for several reasons.
rMSSD reflects high-frequency variability in the heart rate signal, which is predominantly mediated by vagal (parasympathetic) activity via the respiratory sinus arrhythmia mechanism. This vagal component is the most responsive to acute changes in autonomic balance relevant to recovery state. Critically, rMSSD is relatively stable with respect to measurement duration and breathing frequency variations, making it more reproducible in the field than frequency-domain parameters like HF power, which requires careful control of respiratory rate.
A practical enhancement to raw rMSSD is taking its natural logarithm (Ln(rMSSD)), which normalises the distribution of values across individuals and makes percentage-based comparisons to personal baselines more meaningful. Many validated HRV applications compute this transformation automatically and display a coefficient of variation (CV) alongside the raw value, helping users distinguish genuine trends from normal day-to-day biological fluctuation.
Measurement Protocol: Consistency Is Everything
The physiological validity of HRV monitoring depends entirely on measurement consistency. Variables that influence HRV — body position, breathing pattern, time since waking, caffeine intake, food intake, ambient temperature — must be controlled by establishing a rigid morning protocol and following it identically every day.
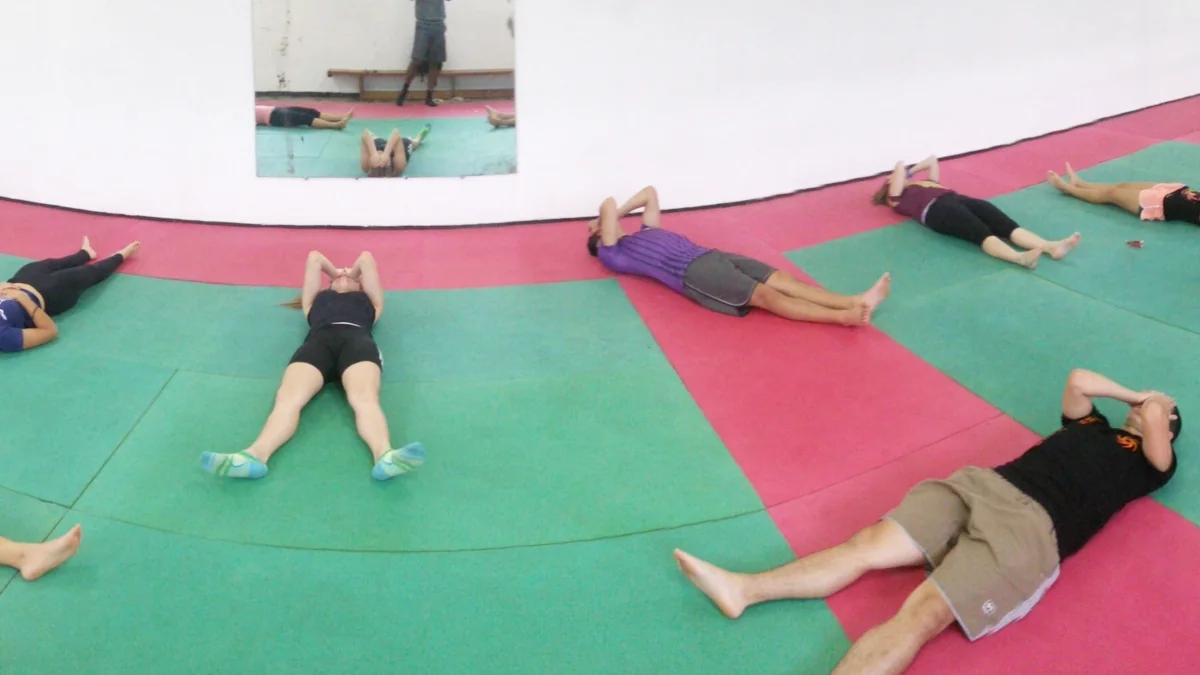
The recommended protocol: immediately upon waking, before getting out of bed, before drinking coffee or eating, lie supine (face up) and begin recording. Record for 60–90 seconds using a validated heart rate strap or capable wearable. Log subjective metrics alongside the HRV reading — sleep quality, perceived recovery, muscle soreness, motivation — as these contextual variables significantly improve interpretation. Complete the measurement before checking emails, news, or other stimuli that could acutely shift autonomic tone.
Position matters substantially. Moving from supine to standing increases sympathetic activation and typically reduces HRV by 15–25%. If you cannot always measure lying down, measure consistently in the same position — the absolute value matters less than the trend relative to your personal baseline. Mixing measurement positions between days introduces systematic noise that makes trend interpretation unreliable.
Building Your Personal Baseline
A morning HRV reading means nothing without context — specifically, without knowing your personal normal range. Two to four weeks of daily measurement during a period of stable, moderate training load establishes this baseline. Calculate the mean and standard deviation of your Ln(rMSSD) values across this period. Your “normal range” is roughly ±1 standard deviation around the mean; values falling outside 1.5–2 standard deviations in either direction represent meaningful deviations worth acting on.
HRV4Training’s research group has proposed the “weekly average HRV” approach as more stable than single-day readings: rather than making each day’s training decision on a single morning measurement, track the 7-day rolling average and respond to trends rather than day-to-day fluctuations. This approach reduces the risk of over-responding to normal biological variation while still capturing genuine physiological signals from accumulated fatigue.
Practical Decision Rules
The Kiviniemi framework provides a starting point for HRV-guided decision making. Applied to a typical weekly training structure, it might operate as follows:
When HRV is within or above your normal range, proceed with the planned hard session. If a high-intensity interval session or threshold run was scheduled, execute it as planned. Your autonomic state suggests you are primed to adapt to and recover from the stimulus.
When HRV falls 1–1.5 standard deviations below your baseline, consider modifying the planned session: reduce total duration by 20–30%, replace intervals with steady-state work at moderate intensity, or shift to a technique or skills session. Your body is signalling increased stress load, and forcing a high-quality hard session is likely to produce suboptimal adaptation and extended recovery time.
When HRV falls more than 1.5–2 standard deviations below baseline — particularly if this coincides with elevated resting heart rate, subjective fatigue, or reduced motivation — replace the planned session with a recovery session (easy walking, light cycling, stretching, or complete rest). Investigate the non-training sources of stress: sleep, nutrition, illness onset, life stress.
Which Apps Are Evidence-Based?
HRV4Training was developed by Marco Altini, a researcher with a PhD in wearable sensor technology, and has been validated in multiple peer-reviewed studies. It uses the phone’s rear-facing camera to detect pulse plethysmography (fingertip resting on the camera lens) and computes rMSSD-based metrics with reasonable accuracy compared to chest strap recordings. Its training load logging and trend analysis features make it one of the most research-aligned consumer HRV applications.
Elite HRV supports chest strap connectivity (Polar H7/H10 recommended) and provides rMSSD data with high accuracy. Its user interface is more complex than some alternatives but offers greater data export flexibility, making it valuable for athletes who want to analyse their data independently or share it with coaches.
Polar’s own ecosystem — the H10 chest strap with Polar Beat or Polar Flow — provides laboratory-grade R-R recording quality. The Polar Nightly Recharge feature in their watches integrates overnight heart rate variability with autonomic nervous system state assessment, providing a morning readiness indicator that has been validated against clinical-grade measurements in published studies.
Consumer wearables including the Apple Watch Series 4+, Garmin watches, and WHOOP band provide HRV data with varying accuracy. Apple Watch Series 6 and later show acceptable rMSSD accuracy in validation studies when the user is still during measurement. WHOOP provides continuous wrist-based rMSSD estimation during sleep, which some research suggests captures trends adequately for training guidance even if absolute accuracy is lower than chest strap recordings. The key limitation of wrist-based optical sensors is motion artefact — HRV measurements should ideally be taken during periods of complete stillness, not during sleep when movement is unavoidable.
Conclusion
HRV monitoring provides athletes with a daily, objective signal about their autonomic nervous system’s state — a signal that carries real information about training readiness and recovery status when measured consistently and interpreted with appropriate context. Kiviniemi’s research demonstrates that acting on this signal — performing hard sessions when HRV is favourable, and backing off when it is depressed — produces better physiological adaptations and less subjective fatigue than ignoring it. The best apps are those with validated measurement methods, rMSSD-based metrics, and features for tracking both HRV trends and contextual variables simultaneously.
For comprehensive endurance training science including monitoring strategies, periodization, and performance physiology, visit sporeus.com/threshold/ and explore THRESHOLD.
References
- Kiviniemi AM, Hautala AJ, Kinnunen H, Tulppo MP. (2007). Endurance training guided individually by daily heart rate variability measurements. European Journal of Applied Physiology, 101(6): 743–751. doi:10.1007/s00421-007-0552-2
- Vesterinen V, Nummela A, Heikura I, et al. (2016). Individual endurance training prescription with heart rate variability. Medicine & Science in Sports & Exercise, 48(7): 1347–1354. doi:10.1249/MSS.0000000000000910
- Plews DJ, Laursen PB, Stanley J, Kilding AE, Buchheit M. (2013). Training adaptation and heart rate variability in elite endurance athletes: opening the door to effective monitoring. Sports Medicine, 43(9): 773–781. doi:10.1007/s40279-013-0071-8
The Physiology of HRV: What You Are Actually Measuring
The interval between consecutive heartbeats — the R-R interval, named for the R-peak in an electrocardiogram waveform — varies continuously in milliseconds. This beat-to-beat variation is regulated by the interplay of sympathetic and parasympathetic branches of the autonomic nervous system. The sympathetic branch (fight-or-flight) shortens…
Kiviniemi's Research: The Evidence Foundation
Tae Kiviniemi and colleagues at the University of Oulu in Finland produced the most directly relevant controlled research on HRV-guided training in endurance athletes. Their 2007 and 2010 studies compared a group whose training intensity was prescribed based on daily morning HRV readings against a…
rMSSD: The Right Metric for Athletic Monitoring
HRV can be quantified by many mathematical parameters, broadly grouped into time-domain, frequency-domain, and nonlinear methods. For the specific application of daily athletic monitoring, research strongly favours rMSSD — the root mean square of successive differences between adjacent R-R intervals — for several reasons.
Measurement Protocol: Consistency Is Everything
The physiological validity of HRV monitoring depends entirely on measurement consistency. Variables that influence HRV — body position, breathing pattern, time since waking, caffeine intake, food intake, ambient temperature — must be controlled by establishing a rigid morning protocol and following it identically every day.
Building Your Personal Baseline
A morning HRV reading means nothing without context — specifically, without knowing your personal normal range. Two to four weeks of daily measurement during a period of stable, moderate training load establishes this baseline. Calculate the mean and standard deviation of your Ln(rMSSD) values across…