Preview
Hüseyin Akbulut, MSc (2026). Aerobic or Anaerobic? Energy Systems and Threshold Zones. Sporeus. Retrieved, November 19, 2026. https://sporeus.com/en/science/aerobic-or-anaerobic-energy-systems-threshold-zones/
“Aerobic or anaerobic?” It is a question asked in gyms every day, and it is almost always answered wrongly. The reality is that all three energy systems work at the same time. Aerobic and anaerobic are not two separate switches; they are the two ends of a dial. Even in a 400 m sprint, roughly 40 to 50% of the energy comes from aerobic metabolism, and even in a marathon, anaerobic glycolysis kicks in during the final sprint. “Aerobic or anaerobic?” is the wrong question; “in what proportion, and when?” is the right one (Gastin, 2001).
Table of Contents
- Three Energy Systems: Simultaneous, Not Sequential
- The Crossover Point: What Changes as Intensity Rises?
- Two Thresholds: The Physiological Basis of Training Zones
- In Practice: Which Intensity for What?
- Training Zones in Practice: 3, 5 or 7 Zones?
- Energy Profiles by Sport
- The Crossover Point and Individual Differences
- Conclusion: A Dial, Not a Switch
- References
Three Energy Systems: Simultaneous, Not Sequential
ATP-PCr (phosphagen): the first 5 to 10 seconds. Immediate and independent of oxygen: phosphate is transferred from creatine phosphate to ADP. Its capacity is small, enough for the start of a sprint. About half of the stores are restored within 30 seconds, and most of them within 3 to 5 minutes.
Anaerobic glycolysis: dominant from about 10 seconds to 2 minutes. It produces 2 to 3 ATP per glucose unit. Its advantage is speed: it supplies ATP two to three times faster than the oxidative system. The price is the accumulation of hydrogen ions, acidosis, which disrupts the contractile mechanics of the muscle. The 400 m (about 45 to 50 seconds at elite level) is the purest expression of this system.
Oxidative phosphorylation: contributes from the first seconds, becomes dominant within 1 to 2 minutes of maximal effort and approaches its peak rate after 2 to 3 minutes. It yields about 30 to 32 ATP per glucose and, by current calculations, about 106 ATP per palmitate (a fatty acid; older textbooks give 129). Efficient but slow and rate-limited, it is the marathon runner’s main engine. Most of the body’s ATP is produced in the mitochondria (Brooks, 2018).
The Crossover Point: What Changes as Intensity Rises?
George Brooks’s crossover concept: at low intensities (25 to 30% of VO₂max), fat supplies 60 to 80% of total energy. As intensity rises, the share of carbohydrate increases until the two contribute about equally at a moderate intensity; above about 80% of VO₂max, carbohydrate supplies 85 to 90%. Why? Rising calcium activates pyruvate dehydrogenase (PDH), channelling pyruvate into the Krebs cycle, while falling free carnitine and accumulating malonyl-CoA inhibit CPT1 and choke the supply of fat to the mitochondria. There is also a biochemical constraint: per unit of oxygen consumed, carbohydrate yields about 5 to 10% more energy than fat (Jeukendrup, 2011).
Two Thresholds: The Physiological Basis of Training Zones
First threshold (LT1): blood lactate around 2 mmol/L. Production and clearance are in balance. Sustainable for hours, at a conversational pace. In sedentary people it lies at 50 to 60% of VO₂max, in trained people at 65 to 75%.
Second threshold (LT2): blood lactate around 4 mmol/L (OBLA, onset of blood lactate accumulation). Accumulation exceeds clearance. Most athletes can sustain this intensity for roughly 30 to 60 minutes. In elite athletes it lies at about 80 to 90% of VO₂max; the 4 mmol/L value is only a rough approximation of an individual threshold. In the polarised model, zone 1 sits below LT1 (about 80% of volume), zone 3 above LT2 (about 20%), and zone 2, the “no man’s land” in between, is kept to a minimum.
These two thresholds are the true physiological counterpart of the aerobic/anaerobic distinction. Everything below LT1 is predominantly aerobic; above LT2, the anaerobic contribution and metabolite accumulation rise quickly. Even so, in efforts lasting more than a few minutes most of the energy is still aerobic. The transition between them is gradual, not sharp; it does not switch on and off like a button (Faude et al., 2009).
In Practice: Which Intensity for What?
Zone 1 (below LT1): mitochondrial biogenesis, a denser capillary network and greater fat-oxidation capacity, with PGC-1α activated via the CaMK pathway. It can be done in high volume at a low recovery cost. This is where the aerobic base is built.
Zone 2 (between LT1 and LT2): it looks like a sweet spot, but used chronically and without a plan it becomes a problem: not easy enough for recovery, not hard enough for the strongest adaptations. Planned threshold sessions have an important place in elite programmes; the problem is when every session drifts into this zone by default.
Zone 3 (above LT2): AMPK phosphorylation, PGC-1α and mitochondrial adaptation (particularly in type II fibres), plus development of VO₂max and neuromuscular power. Use it in limited doses with full recovery (Seiler & Kjerland, 2006).
Training Zones in Practice: 3, 5 or 7 Zones?
Several models are used to classify training intensity, and their number causes confusion. The simplest and best-supported approach is the three-zone model based on the first and second lactate thresholds: zone 1 (below LT1), zone 2 (between LT1 and LT2) and zone 3 (above LT2). Seiler’s research on polarised training uses this model, and the 80/20 distribution of elite endurance athletes is defined across these three zones.
Five-zone models add granularity: recovery, endurance, tempo, threshold and VO₂max zones. Seven-zone models, common in power-based cycling, also include sprint and neuromuscular zones. More zones mean more precision, but for most athletes the three-zone model is enough. Too many zones complicate training unnecessarily, especially for recreational athletes.
What really matters is not the number of zones but calibration. Zones should be set from the individual’s physiology, ideally with a laboratory test (a lactate profile or gas analysis). Maximum heart rate estimated with the “220 minus age” formula carries an error of ±10 to 15 beats per minute. That error can put an entire training plan in the wrong zone: the run you think is “easy” may actually be at threshold, and the interval you think is “hard” may be too easy. Zone-based training without individual testing is like reading a map without a compass: the direction looks right, but you may end up somewhere quite different (Sylta et al., 2014).
Energy Profiles by Sport
Every sport has its own energy-system profile, and training emphasis should follow it. The marathon is almost entirely aerobic: about 99% oxidative phosphorylation, with only a brief anaerobic contribution in the final sprint. A road cycling race is 85 to 90% aerobic, yet repeated climbs and attacks demand substantial anaerobic capacity. Football rests on a roughly 90% aerobic base, but a match involves hundreds of changes of intensity and dozens of short sprints, each of which draws on PCr and anaerobic glycolysis.
A 100 m swim is roughly a 50/50 balance of aerobic and anaerobic energy. A 2,000 m rowing race has a profile of about 70 to 85% aerobic, and tolerance of acidosis in the last 500 m often decides the race. CrossFit varies enormously: aerobic contribution dominates in long WODs (workouts of the day), while the anaerobic share grows in short AMRAPs.
Understanding the energy profile of your sport is the starting point of training design. Sprints play only a small part in a marathon runner’s training, and a footballer cannot get by on low-intensity running alone. The question “how aerobic, how anaerobic?” does not decide what to train; it decides how the training is distributed (Spencer & Gastin, 2001).
The Crossover Point and Individual Differences
Brooks and Mercier’s crossover concept is a universal principle, but the intensity at which crossover occurs varies widely between individuals. In an untrained person it occurs at about 50% of VO₂max: above that intensity, carbohydrate overtakes fat as the dominant fuel. In a trained endurance athlete the point shifts to a higher percentage, and in some elite athletes higher still; individual differences are large.
Sex also affects the crossover: at the same relative intensity, women oxidise more fat than men, and the lipolysis-promoting, glycogen-sparing effect of oestrogen is the main reason for the difference. Training shifts the crossover point to the right, and low-intensity sessions done fasted can make this shift more pronounced. At race intensity, however, especially at and above threshold, carbohydrate dominance is unavoidable. “Raise your fat-burning capacity, but never neglect carbohydrate in a race”: that balance is the practical translation of crossover physiology (Brooks & Mercier, 1994).
Conclusion: A Dial, Not a Switch
The 400 m is 40 to 50% aerobic. The marathon is more than 99% aerobic, yet anaerobic glycolysis takes over in the final sprint. “Aerobic or anaerobic” is not a binary choice; it is a dial that keeps turning. The aim of training is to develop both ends of it. Knowing which system dominates at a given pace, and understanding your VO₂max and thresholds, guides your pacing and fuelling decisions. To understand the biochemistry is to understand training.
References
- Gastin, P.B. (2001). Energy system interaction and relative contribution during maximal exercise. Sports Medicine.
- Brooks, G.A. (2018). The science and translation of lactate shuttle theory. Cell Metabolism.
- Jeukendrup, A. (2011). Nutrition for endurance sports: marathon, triathlon, and road cycling. Journal of Sports Sciences.
- Faude, O., Kindermann, W., & Meyer, T. (2009). Lactate threshold concepts: how valid are they? Sports Medicine.
- Seiler, K.S., & Kjerland, G.Ø. (2006). Quantifying training intensity distribution in elite endurance athletes: is there evidence for an “optimal” distribution? Scandinavian Journal of Medicine & Science in Sports.
- Sylta, Ø., Tønnessen, E., & Seiler, S. (2014). From heart-rate data to training quantification: a comparison of 3 methods of training-intensity analysis. International Journal of Sports Physiology and Performance.
- Spencer, M.R., & Gastin, P.B. (2001). Energy system contribution during 200- to 1500-m running in highly trained athletes. Medicine & Science in Sports & Exercise.
- Brooks, G.A., & Mercier, J. (1994). Balance of carbohydrate and lipid utilization during exercise: the “crossover” concept. Journal of Applied Physiology.
Related articles:
- Lactate threshold and tempo training
- HRV: tracking recovery with heart rate variability
- Running economy
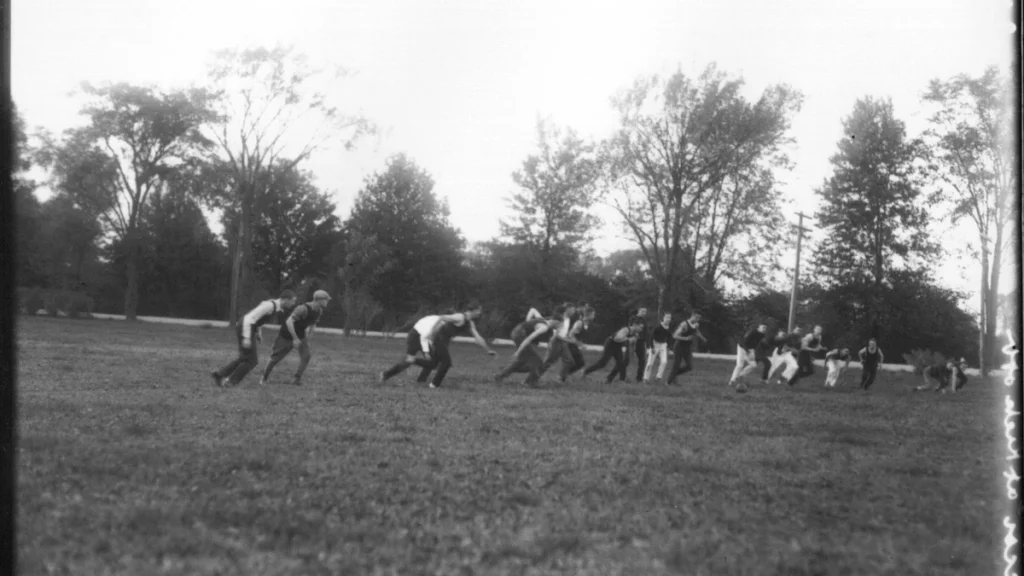
Photo: Frank R. Snyder, public domain (Wikimedia Commons)

Hüseyin Akbulut is the founder of Sporeus and author of THRESHOLD (EŞİK), a 540-page Turkish-language book on endurance science.
- 540pp THRESHOLD Book
- MSc Sport Sciences
- Marmara University
Three Energy Systems: Simultaneous, Not Sequential
ATP-PCr (phosphagen): the first 5 to 10 seconds. Immediate and independent of oxygen: phosphate is transferred from creatine phosphate to ADP. Its capacity is small, enough for the start of a sprint. About half of the stores are restored within 30 seconds, and most of…
The Crossover Point: What Changes as Intensity Rises?
George Brooks's crossover concept: at low intensities (25 to 30% of VO₂max), fat supplies 60 to 80% of total energy. As intensity rises, the share of carbohydrate increases until the two contribute about equally at a moderate intensity; above about 80% of VO₂max, carbohydrate supplies…
Two Thresholds: The Physiological Basis of Training Zones
First threshold (LT1): blood lactate around 2 mmol/L. Production and clearance are in balance. Sustainable for hours, at a conversational pace. In sedentary people it lies at 50 to 60% of VO₂max, in trained people at 65 to 75%.
In Practice: Which Intensity for What?
Zone 1 (below LT1): mitochondrial biogenesis, a denser capillary network and greater fat-oxidation capacity, with PGC-1α activated via the CaMK pathway. It can be done in high volume at a low recovery cost. This is where the aerobic base is built.
Training Zones in Practice: 3, 5 or 7 Zones?
Several models are used to classify training intensity, and their number causes confusion. The simplest and best-supported approach is the three-zone model based on the first and second lactate thresholds: zone 1 (below LT1), zone 2 (between LT1 and LT2) and zone 3 (above LT2).…